I believe data should do more than fill spreadsheets or dashboards; it should help people make better decisions. That's what drives my work.
I help businesses transform raw, messy data into clear insights that reveal opportunities, solve problems, and support confident decision-making. Whether it's cleaning data, analyzing trends, building dashboards, or exploring machine learning solutions, my focus is always the same: turn complexity into clarity.
My journey started with data quality and AI data annotation, where accuracy was everything. Later, working in business development showed me something equally important: even the best data has little value if it doesn't help the business move forward.
That combination shaped how I approach analytics today.
"I don't just ask What does the data say?
I ask What decision can this data help us make?"
Today, I work with Python, SQL, Excel, Power BI, and Machine Learning to build practical solutions for real business challenges. I enjoy finding hidden patterns, creating dashboards that people actually use, and turning numbers into stories that drive action.
What I Enjoy Working On
I'm constantly learning, experimenting, and building projects because every dataset teaches something new.
If my work resonates with you, whether you're looking to collaborate, hire, or simply exchange ideas, I'd love to hear from you.
Let's turn data into better decisions.
Mostafizur Rahman
Mirpur 11, Pallabi,
Dhaka 1216, Bangladesh.
+8801304328058
mostafiz.r.afraim@gmail.com
In my current role, I work at the intersection of data and business. I analyze client data and market trends to understand where growth opportunities exist and how they align with real customer needs. Alongside market research, I handle lead generation and manage prospects using CRM tools, ensuring that follow-ups and pipelines stay organized and actionable.
I regularly prepare proposals and internal reports that translate data insights into practical recommendations for clients and internal teams. This role has strengthened my ability to connect analytical thinking with business outcomes and communicate insights in a way that supports decision-making.
As a Quality Assurance Associate, I was responsible for validating large-scale AI/ML datasets across image, LiDAR, and sensor data, consistently maintaining over 99% data accuracy. I performed routine data quality checks to identify recurring issues and applied corrective actions to ensure datasets were reliable for downstream analysis and model training.
I worked closely with QA teams to refine annotation guidelines applied across multiple projects, improving labeling consistency during quality reviews. I also contributed to improving quality review workflows and supported basic process automation efforts to make reviews more efficient.
In this role, I worked hands-on with dataset preparation for AI/ML projects, annotating and preparing over 20,000+ images, LiDAR scans, and sensor records while consistently meeting productivity and quality standards.
I collaborated with QA teams to refine annotation guidelines and improve review clarity, which helped reduce inconsistencies during quality checks. This role built my foundation in structured data preparation, attention to detail, and working within production-level AI workflows.
During my internship at Hydroquo+, I collected and analyzed over 3 million sensor data points to identify operational trends and anomalies. I developed interactive dashboards and visual reports that helped internal stakeholders better understand system performance and make more informed decisions.
I also worked with cross-functional teams to improve data collection and reporting processes, gaining practical experience in data analysis, visualization, and quality control in a real-world operational environment.
I earned my Bachelor of Science in Physics, studying courses like Linear Algebra, Calculus, Quantum Mechanics, Computational Physics, Statistics and Statistical Physics. I also gained practical experience using MATLAB for problem-solving and simulations. This foundation sharpened my analytical skills and sparked my interest in data-driven technologies, paving the way for my move into AI and machine learning.
Completed a hands-on program focused on practical skills in Data Science and Machine Learning. Gained experience with Python, SQL, and a variety of data science tools. Covered topics such as data science methodology, data visualization, data analysis, and building machine learning models. Worked on multiple cloud-based labs and assignments, culminating in a Capstone Project that demonstrated real-world application of acquired skills.
Completed a 9-course program covering the core principles of data analysis, with hands-on projects using real-world datasets. Gained practical experience in Excel, SQL, Python, Jupyter Notebooks, Relational Databases, and Cognos Analytics. Developed skills in data manipulation, analysis, visualization, and dashboard creation, equipping me for entry-level roles in data analytics.
Gained an understanding of common careers and industries that rely on Business Intelligence (BI). Explored how data influences strategic decision-making and learned about the key roles BI professionals play within organizations. Developed a basic BI project plan, reinforcing the principles of data-driven business solutions.
Learned how to use Excel and Power BI to collect, manage, and share data for collaborative, data-driven decision-making. Gained practical skills in Data Analysis, Business Intelligence, Business Analytics, Data Import/Export, and Data Analysis Expressions (DAX).
I specialize in data analysis, visualization, and applied machine learning, using hands-on experience from projects and professional work to solve real-world problems. Below is a summary of my core technical skills and confidence levels.
The progress bars reflect my confidence level in using each skill or tool.
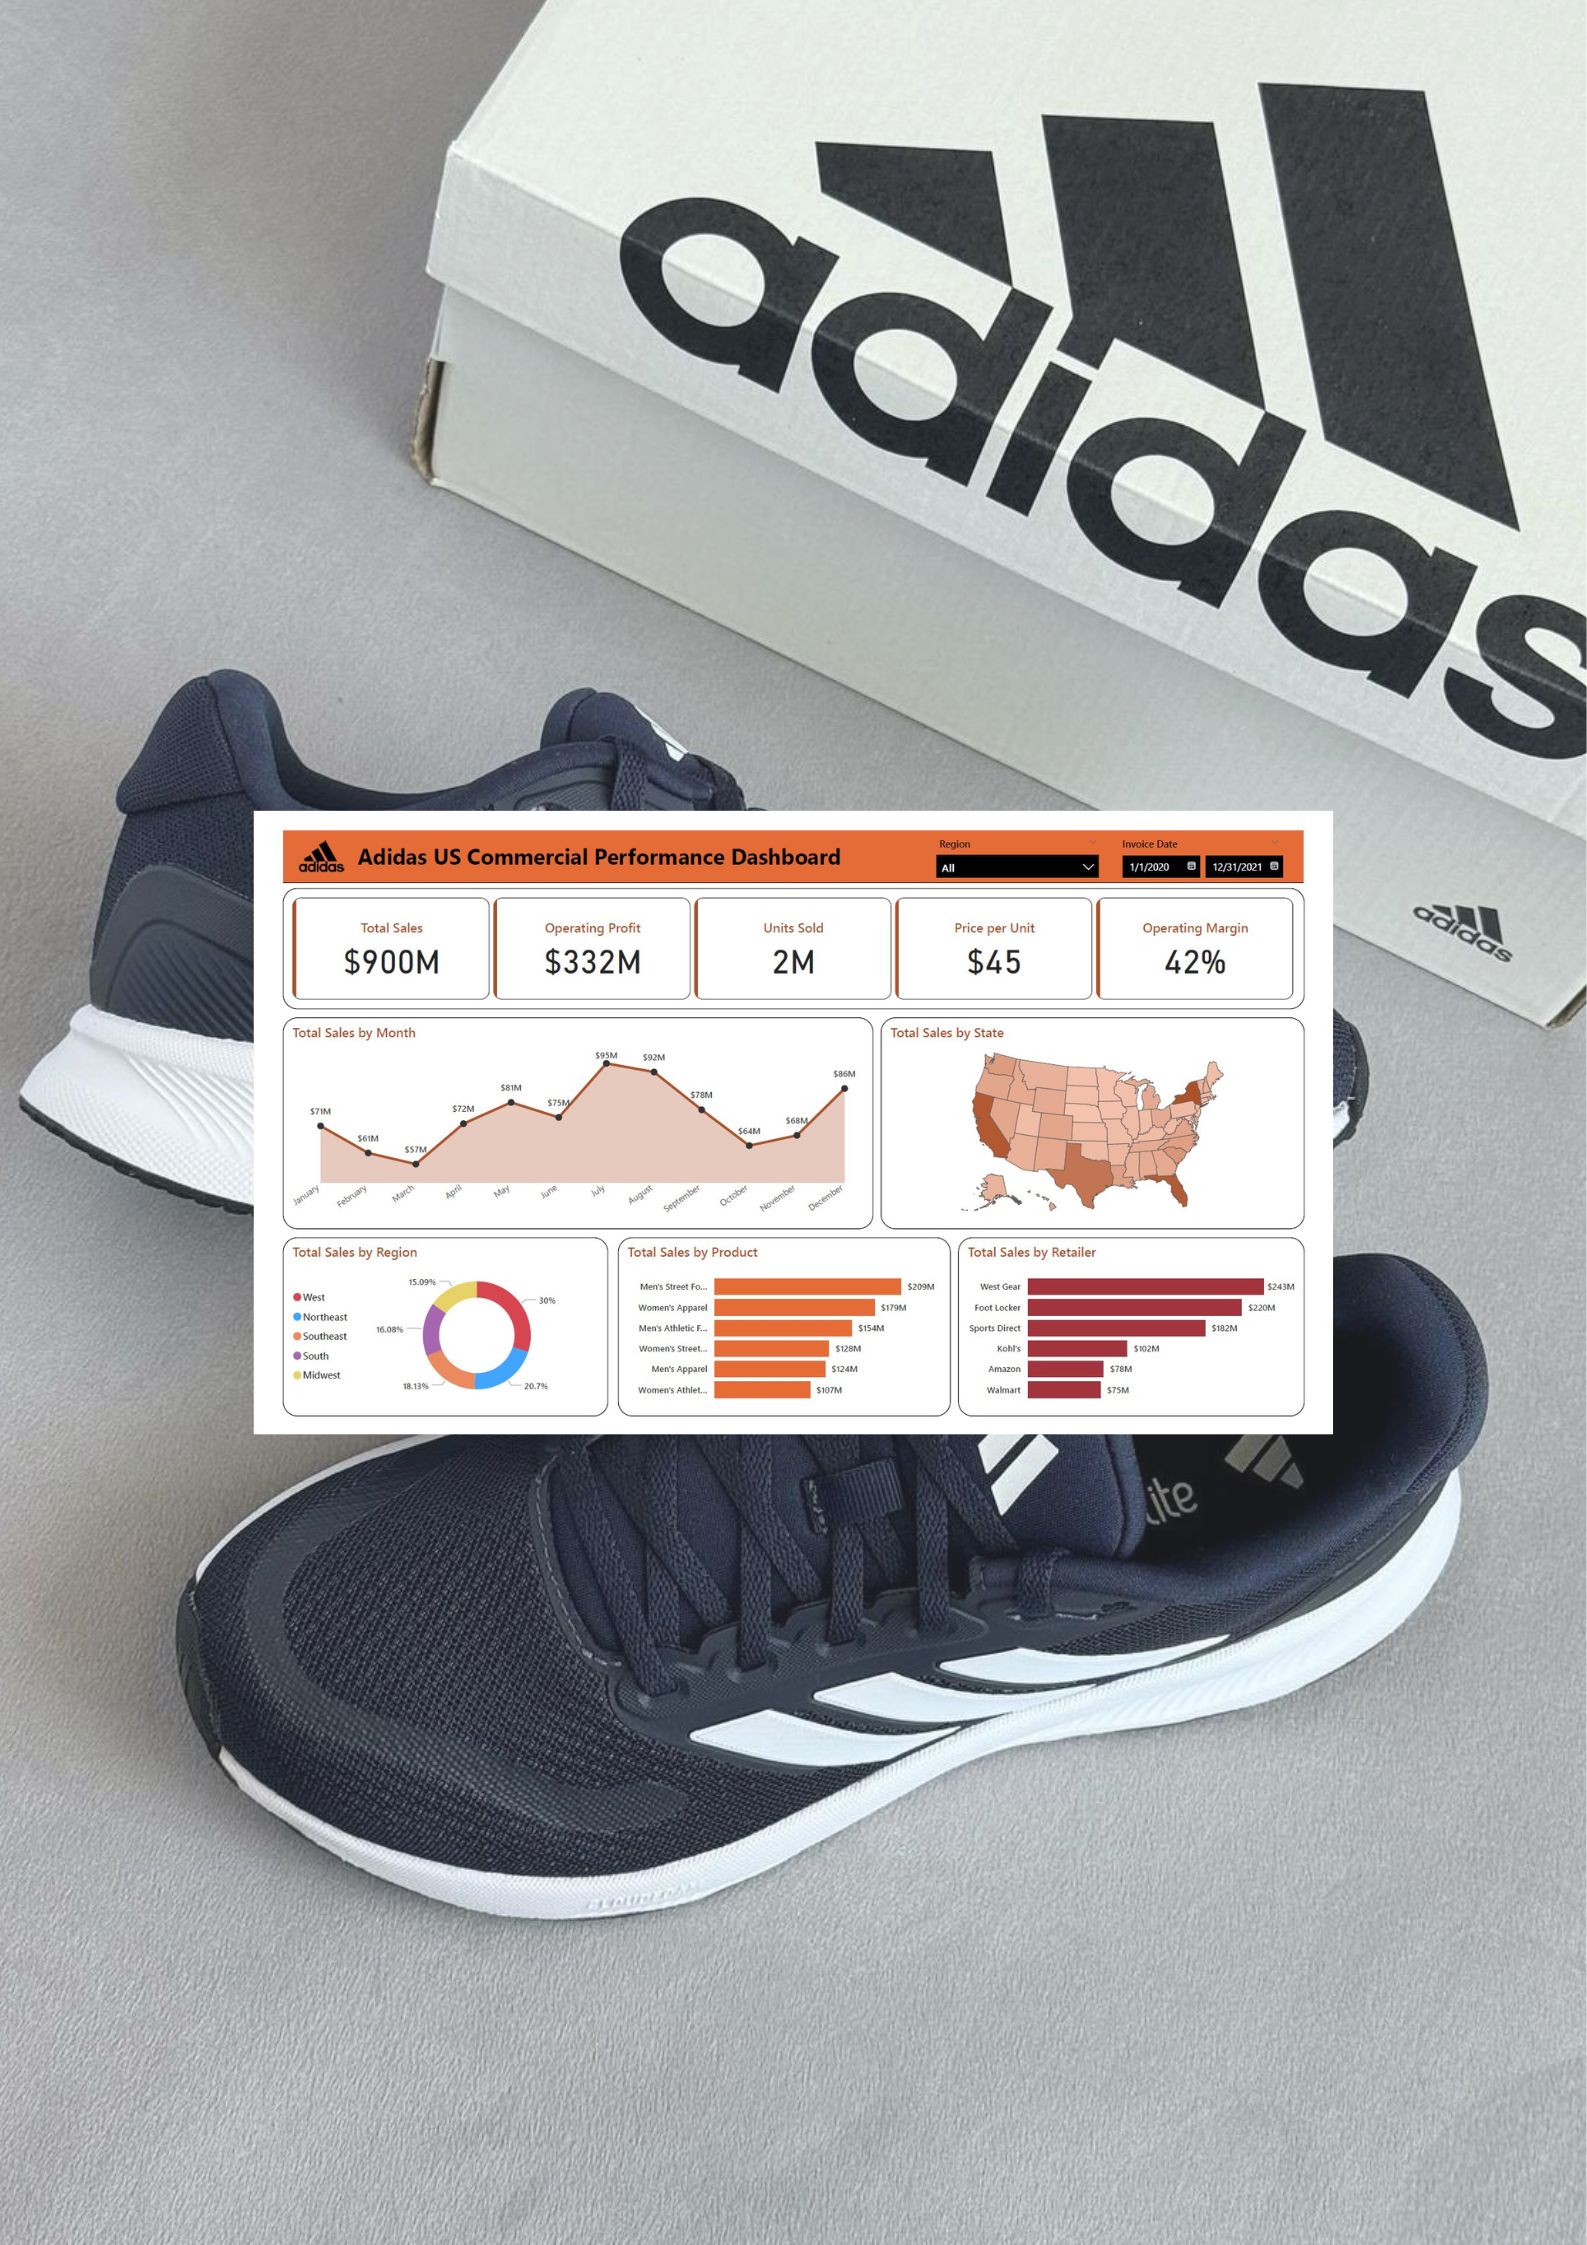
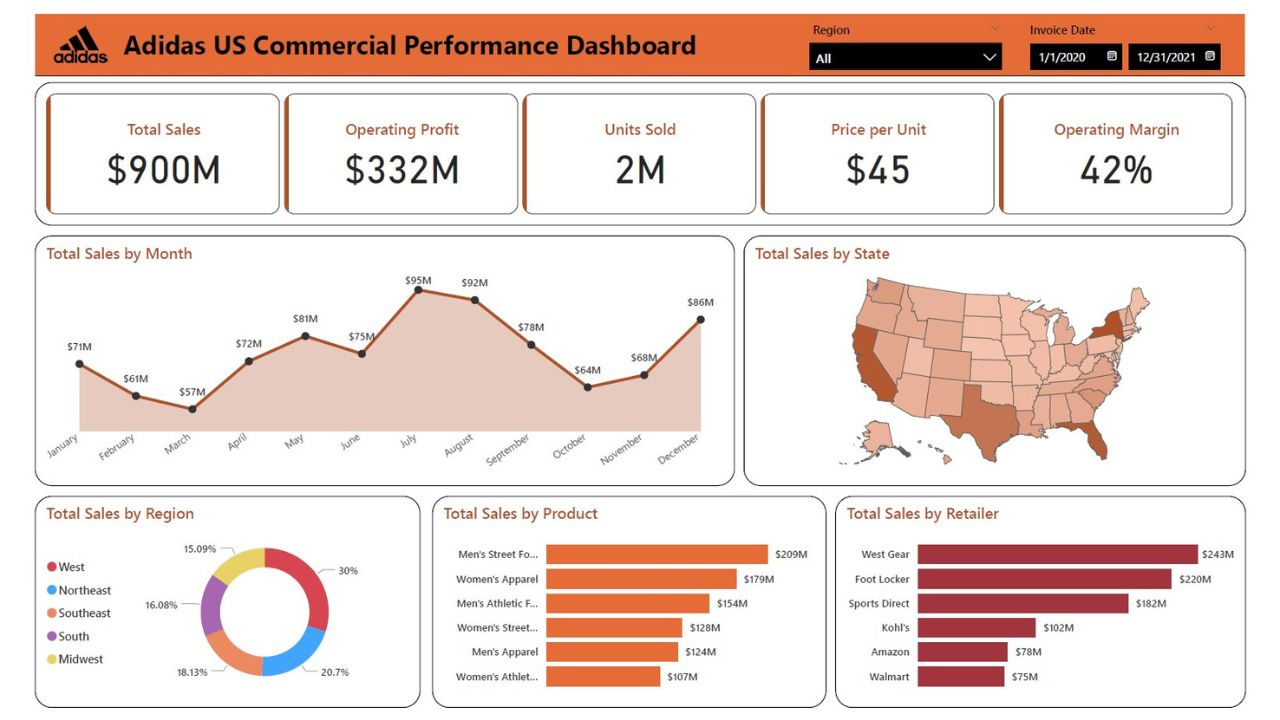
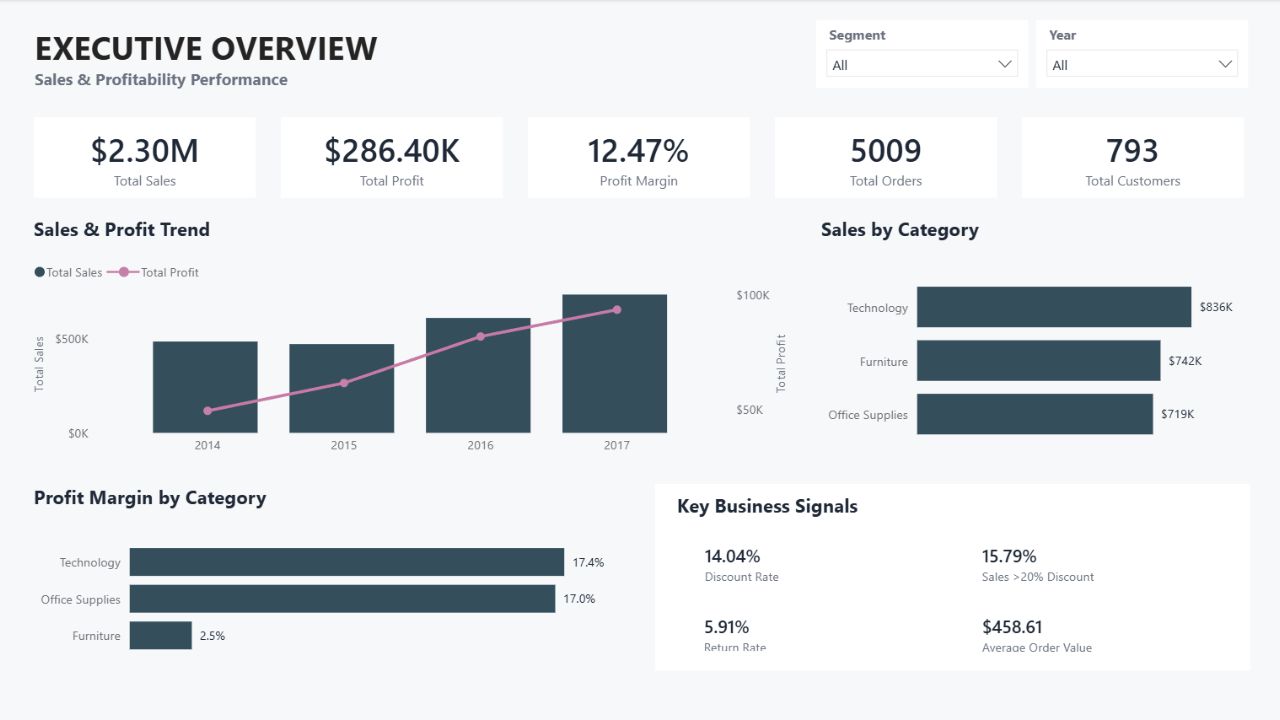
A decision-oriented Power BI dashboard built to analyze Adidas US sales and profitability, identify margin leakage across retail channels, and provide actionable insights for optimizing revenue and commercial strategy.
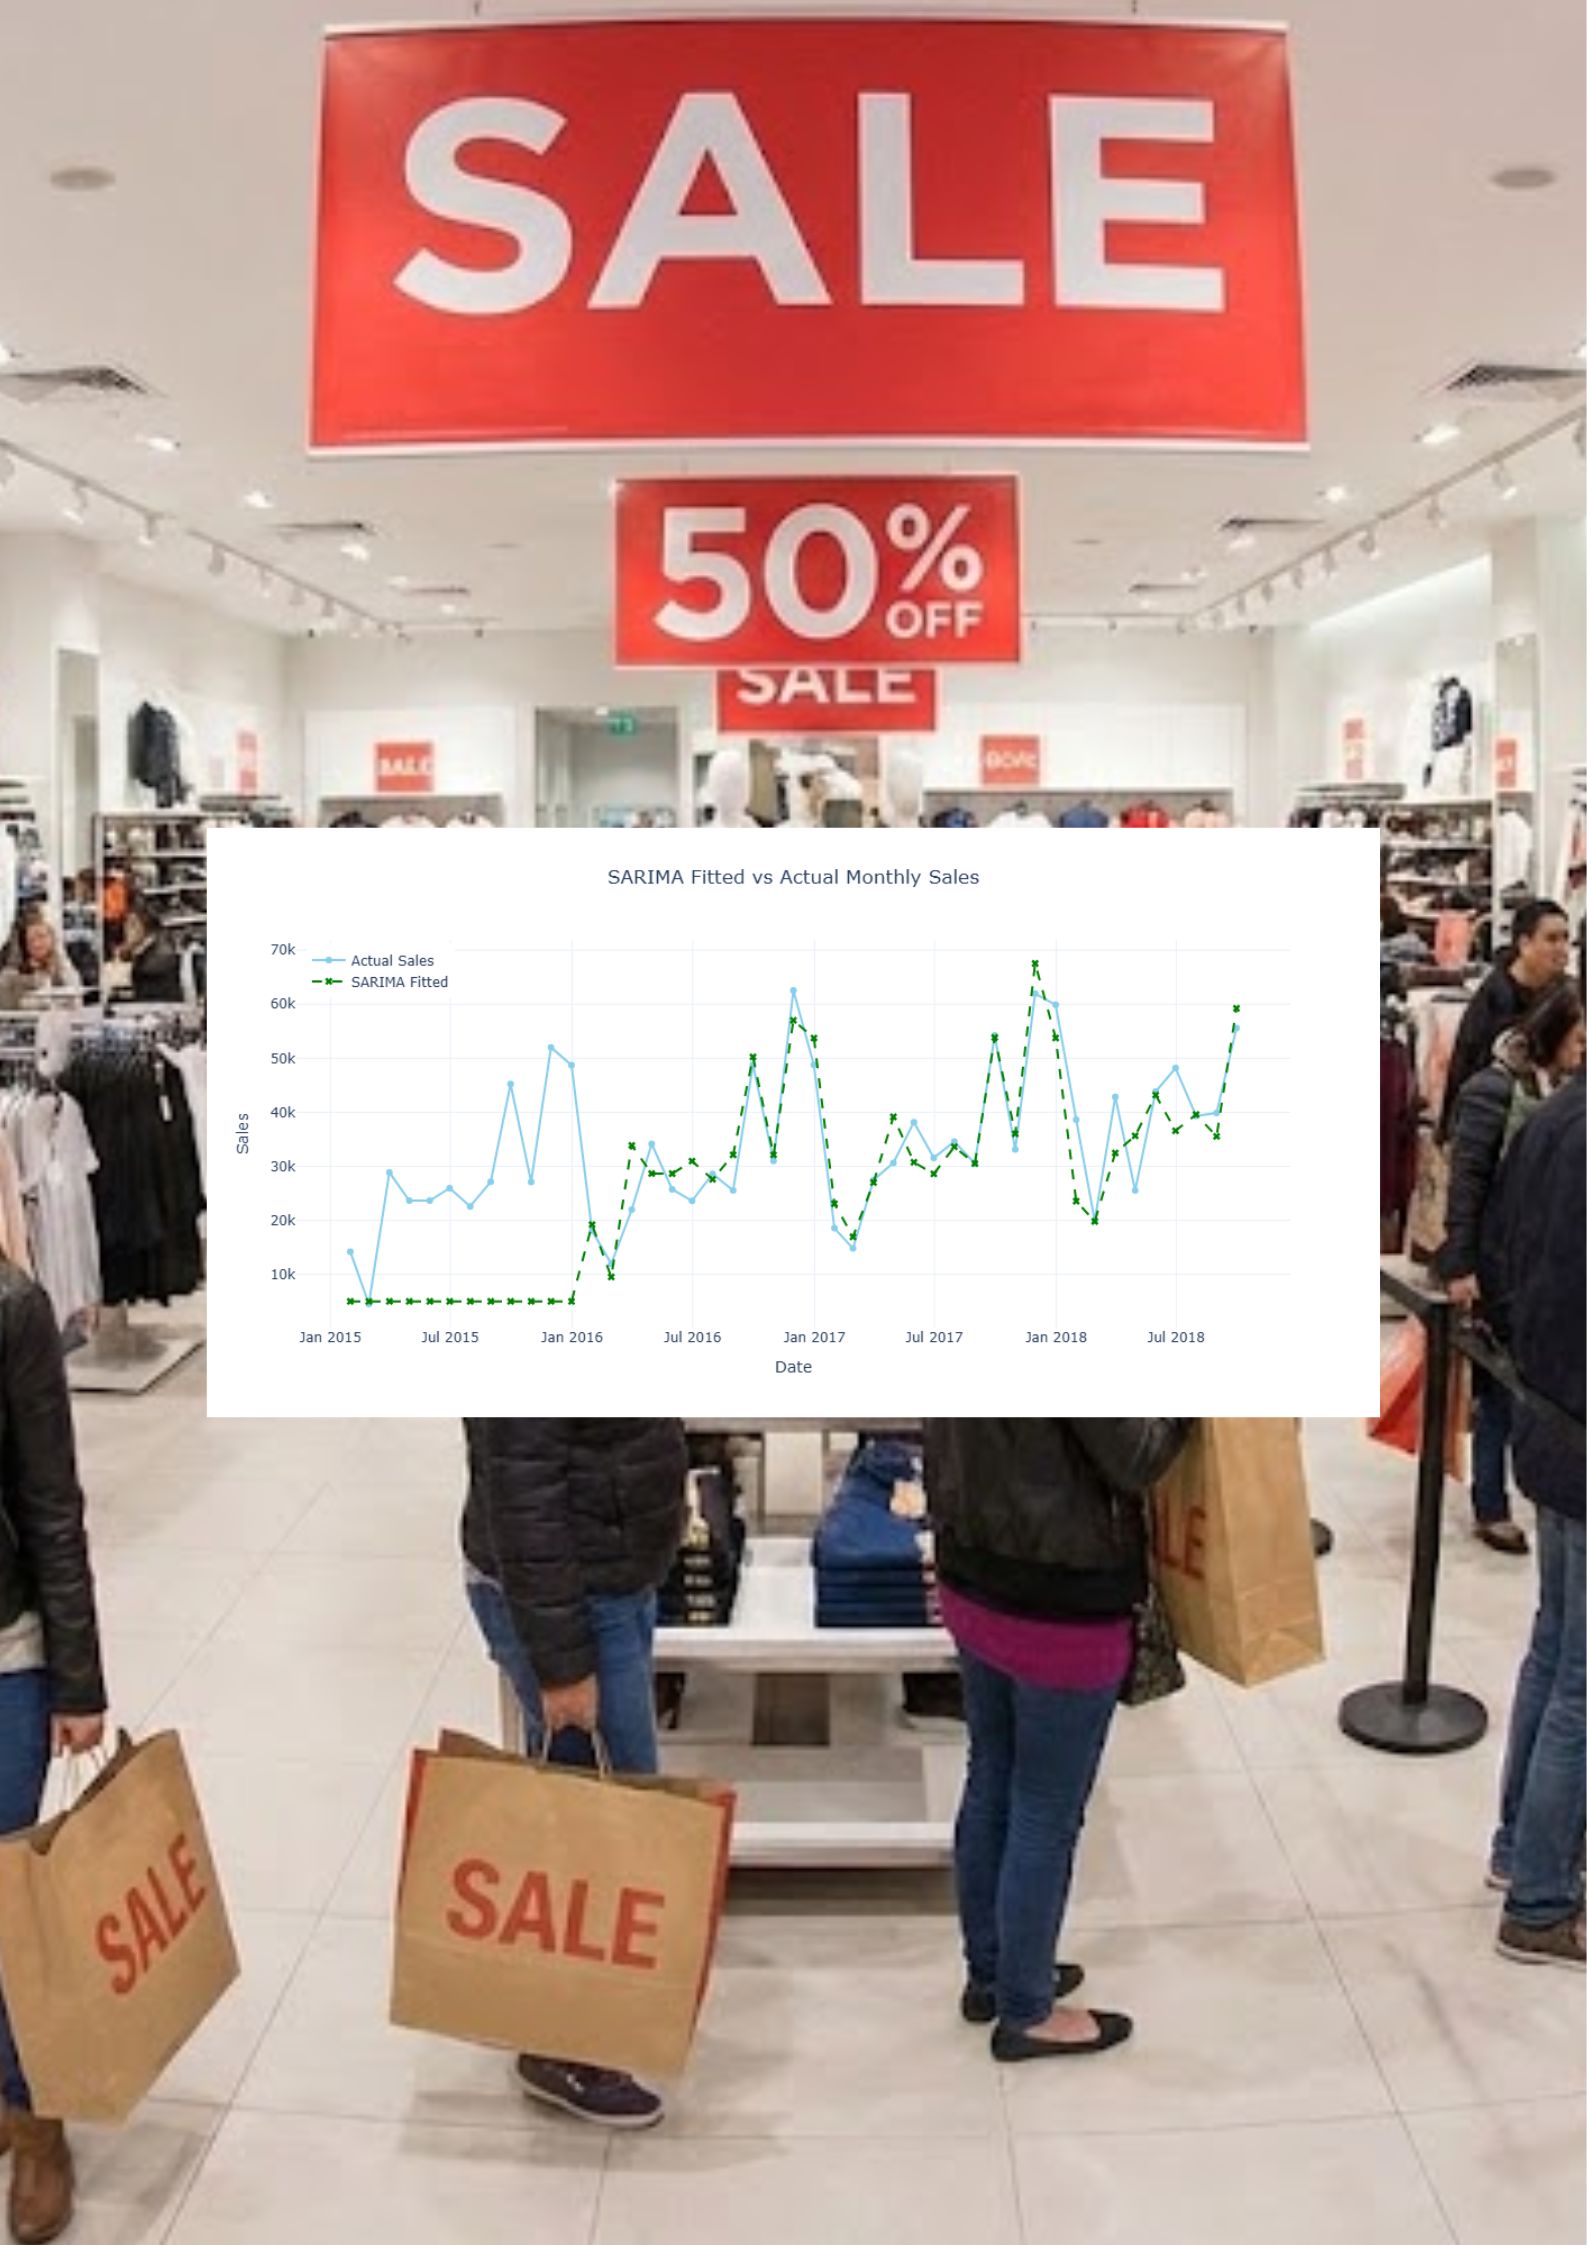
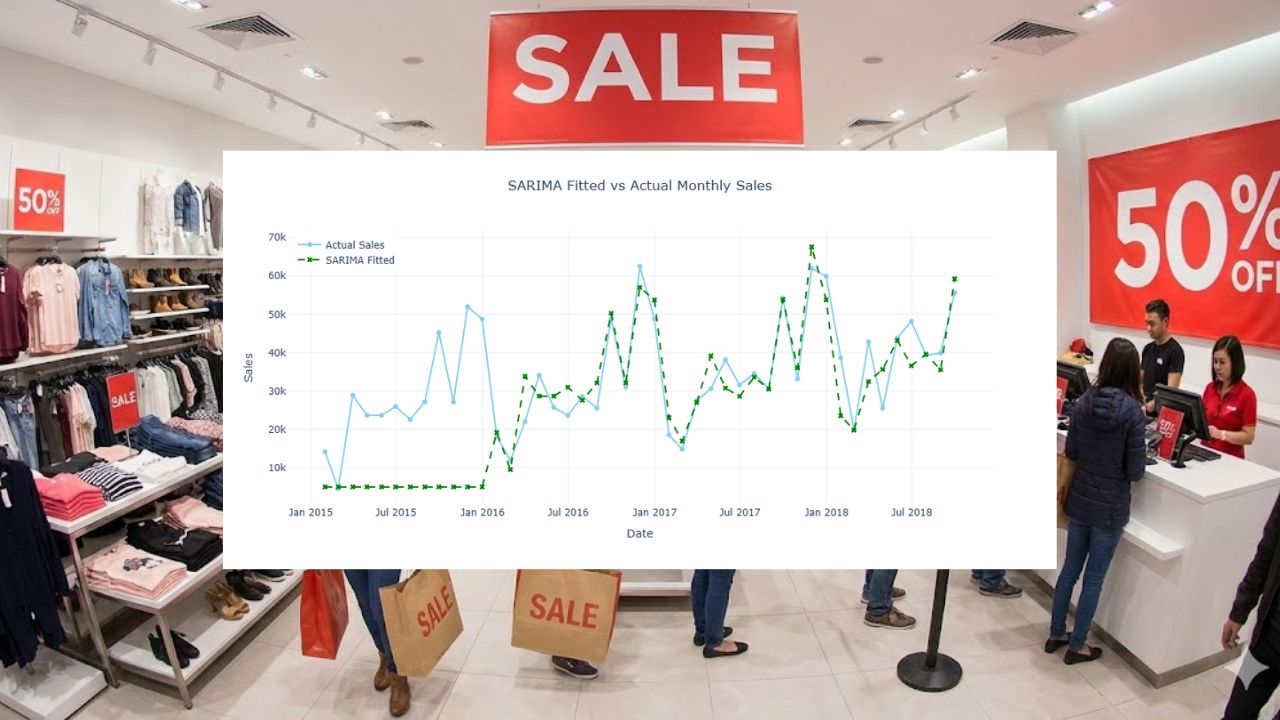
End-to-end retail sales analysis and time-series forecasting project using SARIMA to uncover seasonal patterns and deliver reliable monthly sales predictions for strategic decision-making.
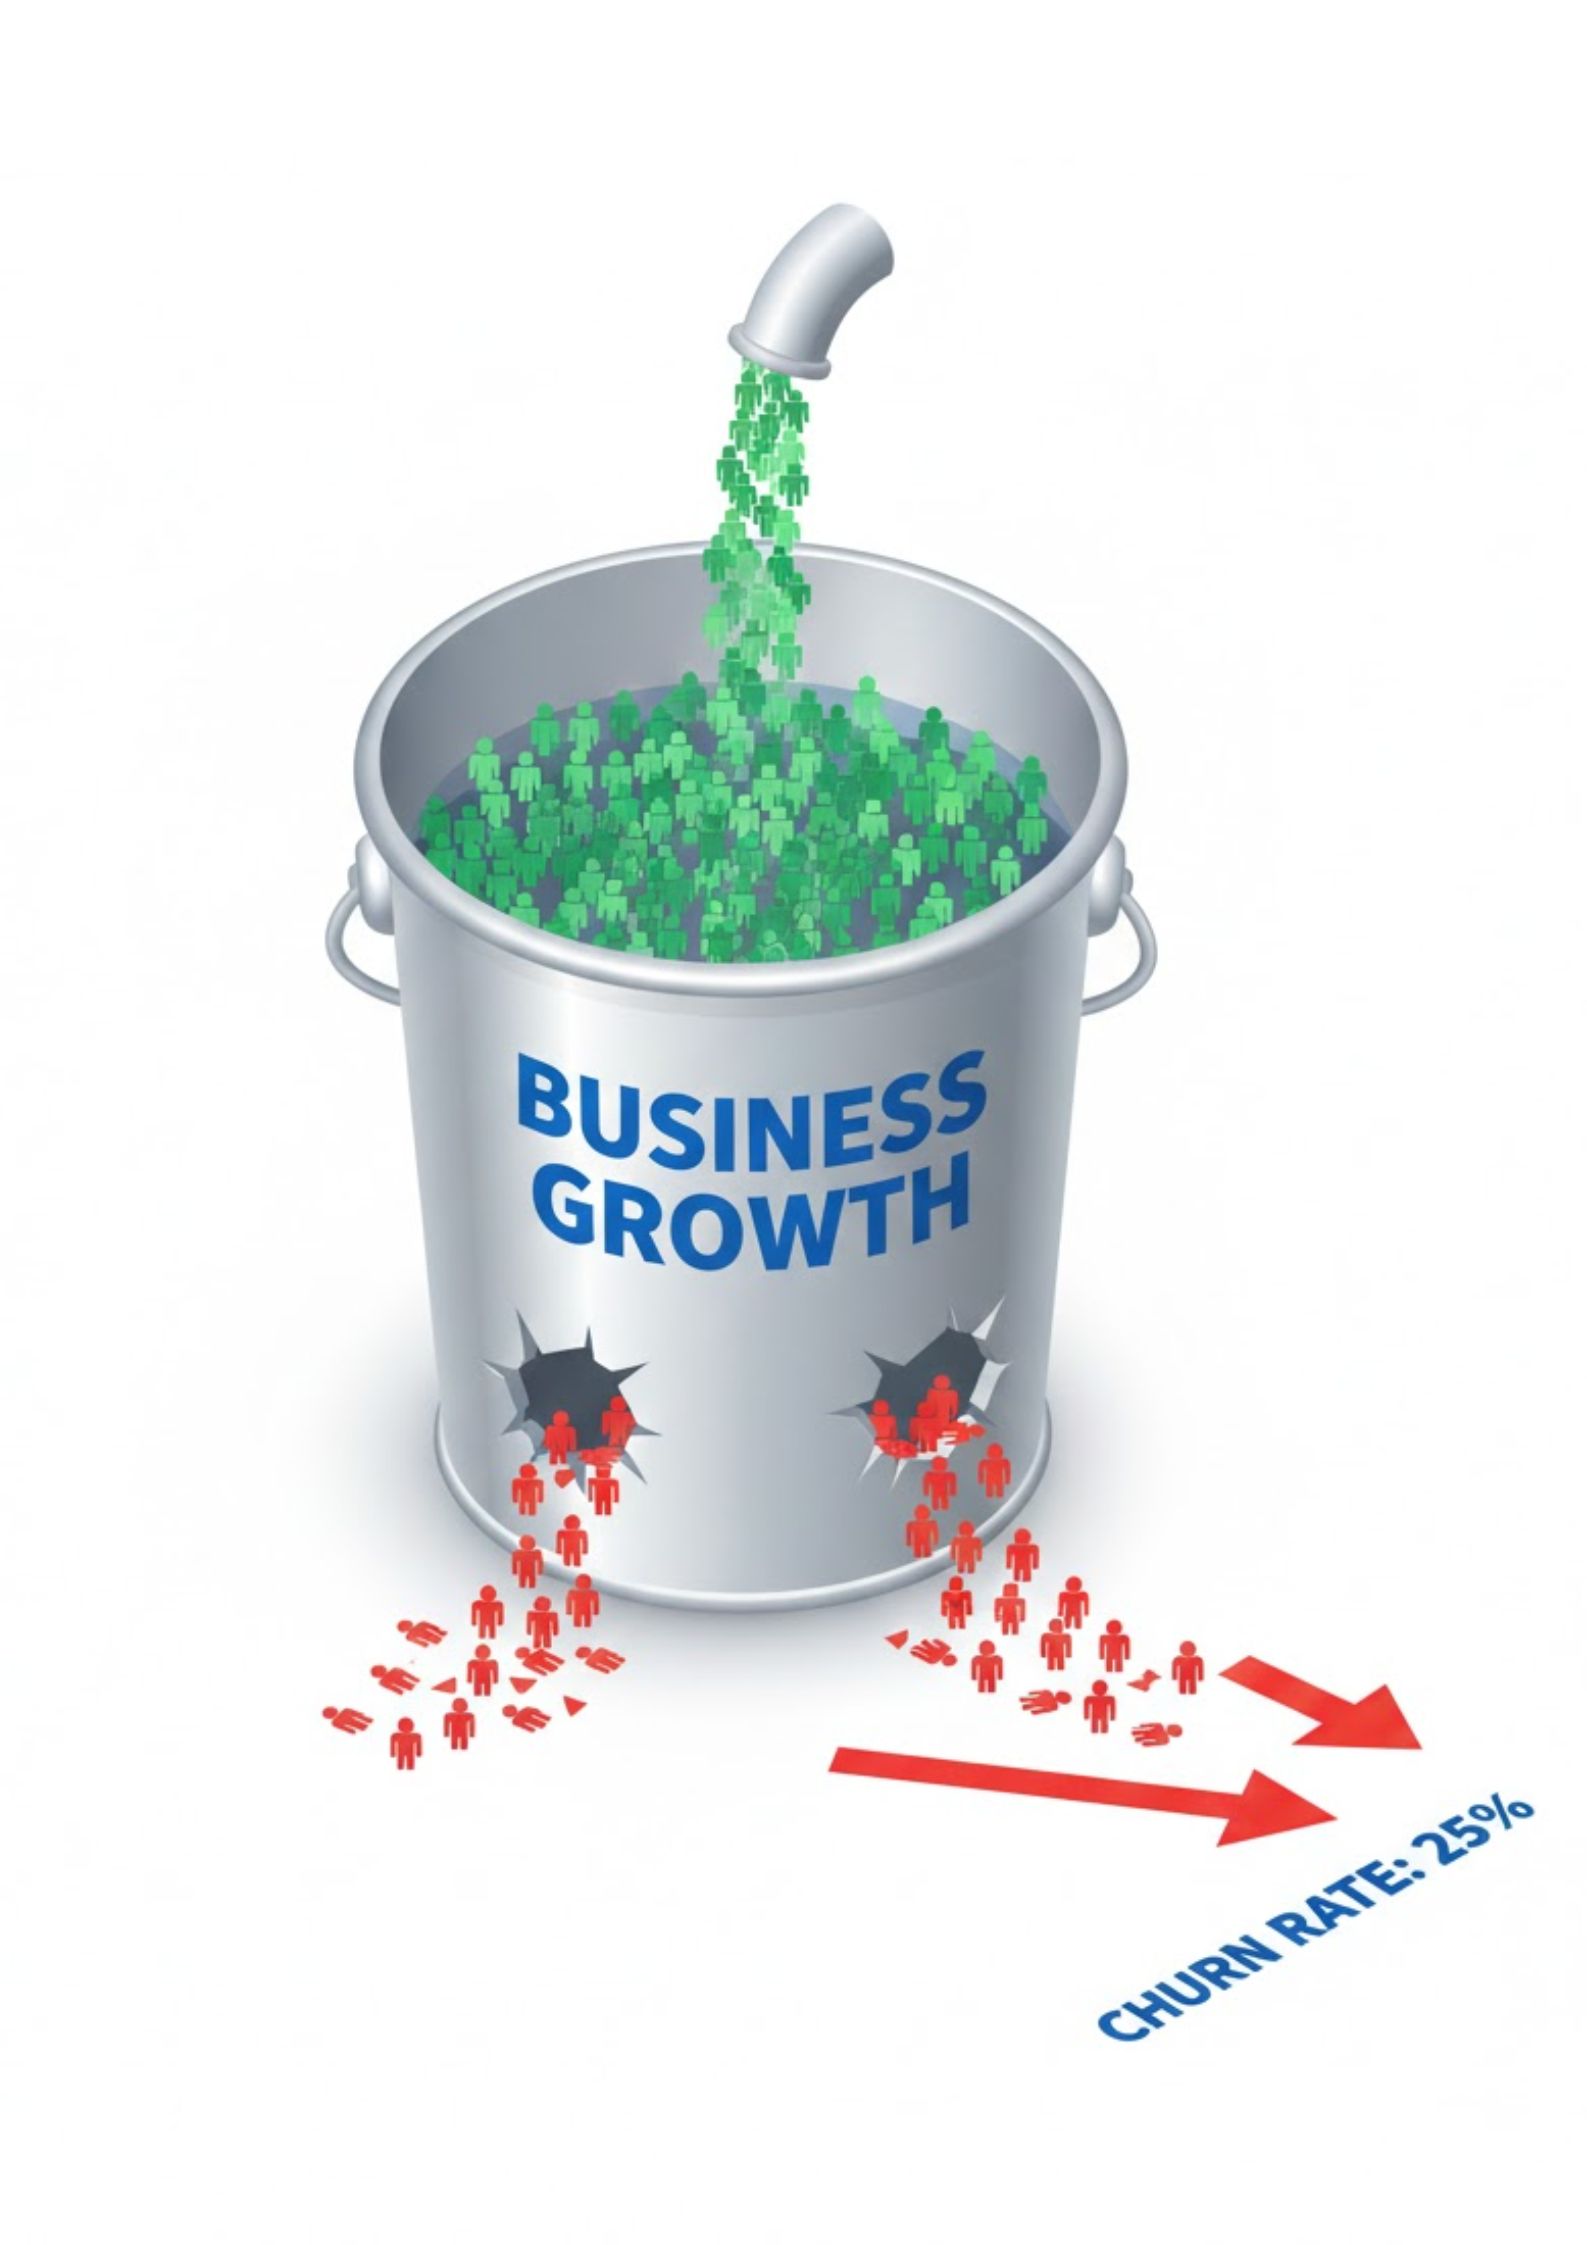
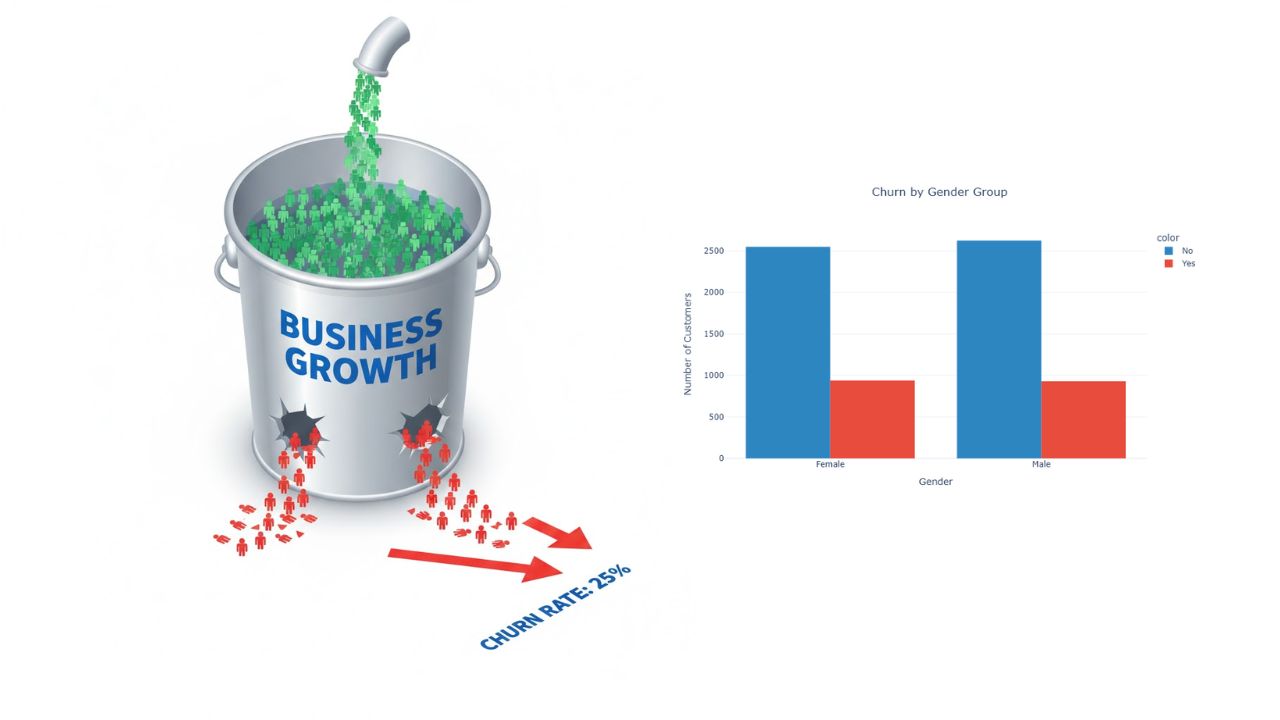
End-to-end customer churn prediction project using advanced machine learning to model imbalanced data, optimize recall and PR-AUC, and deliver actionable retention insights.
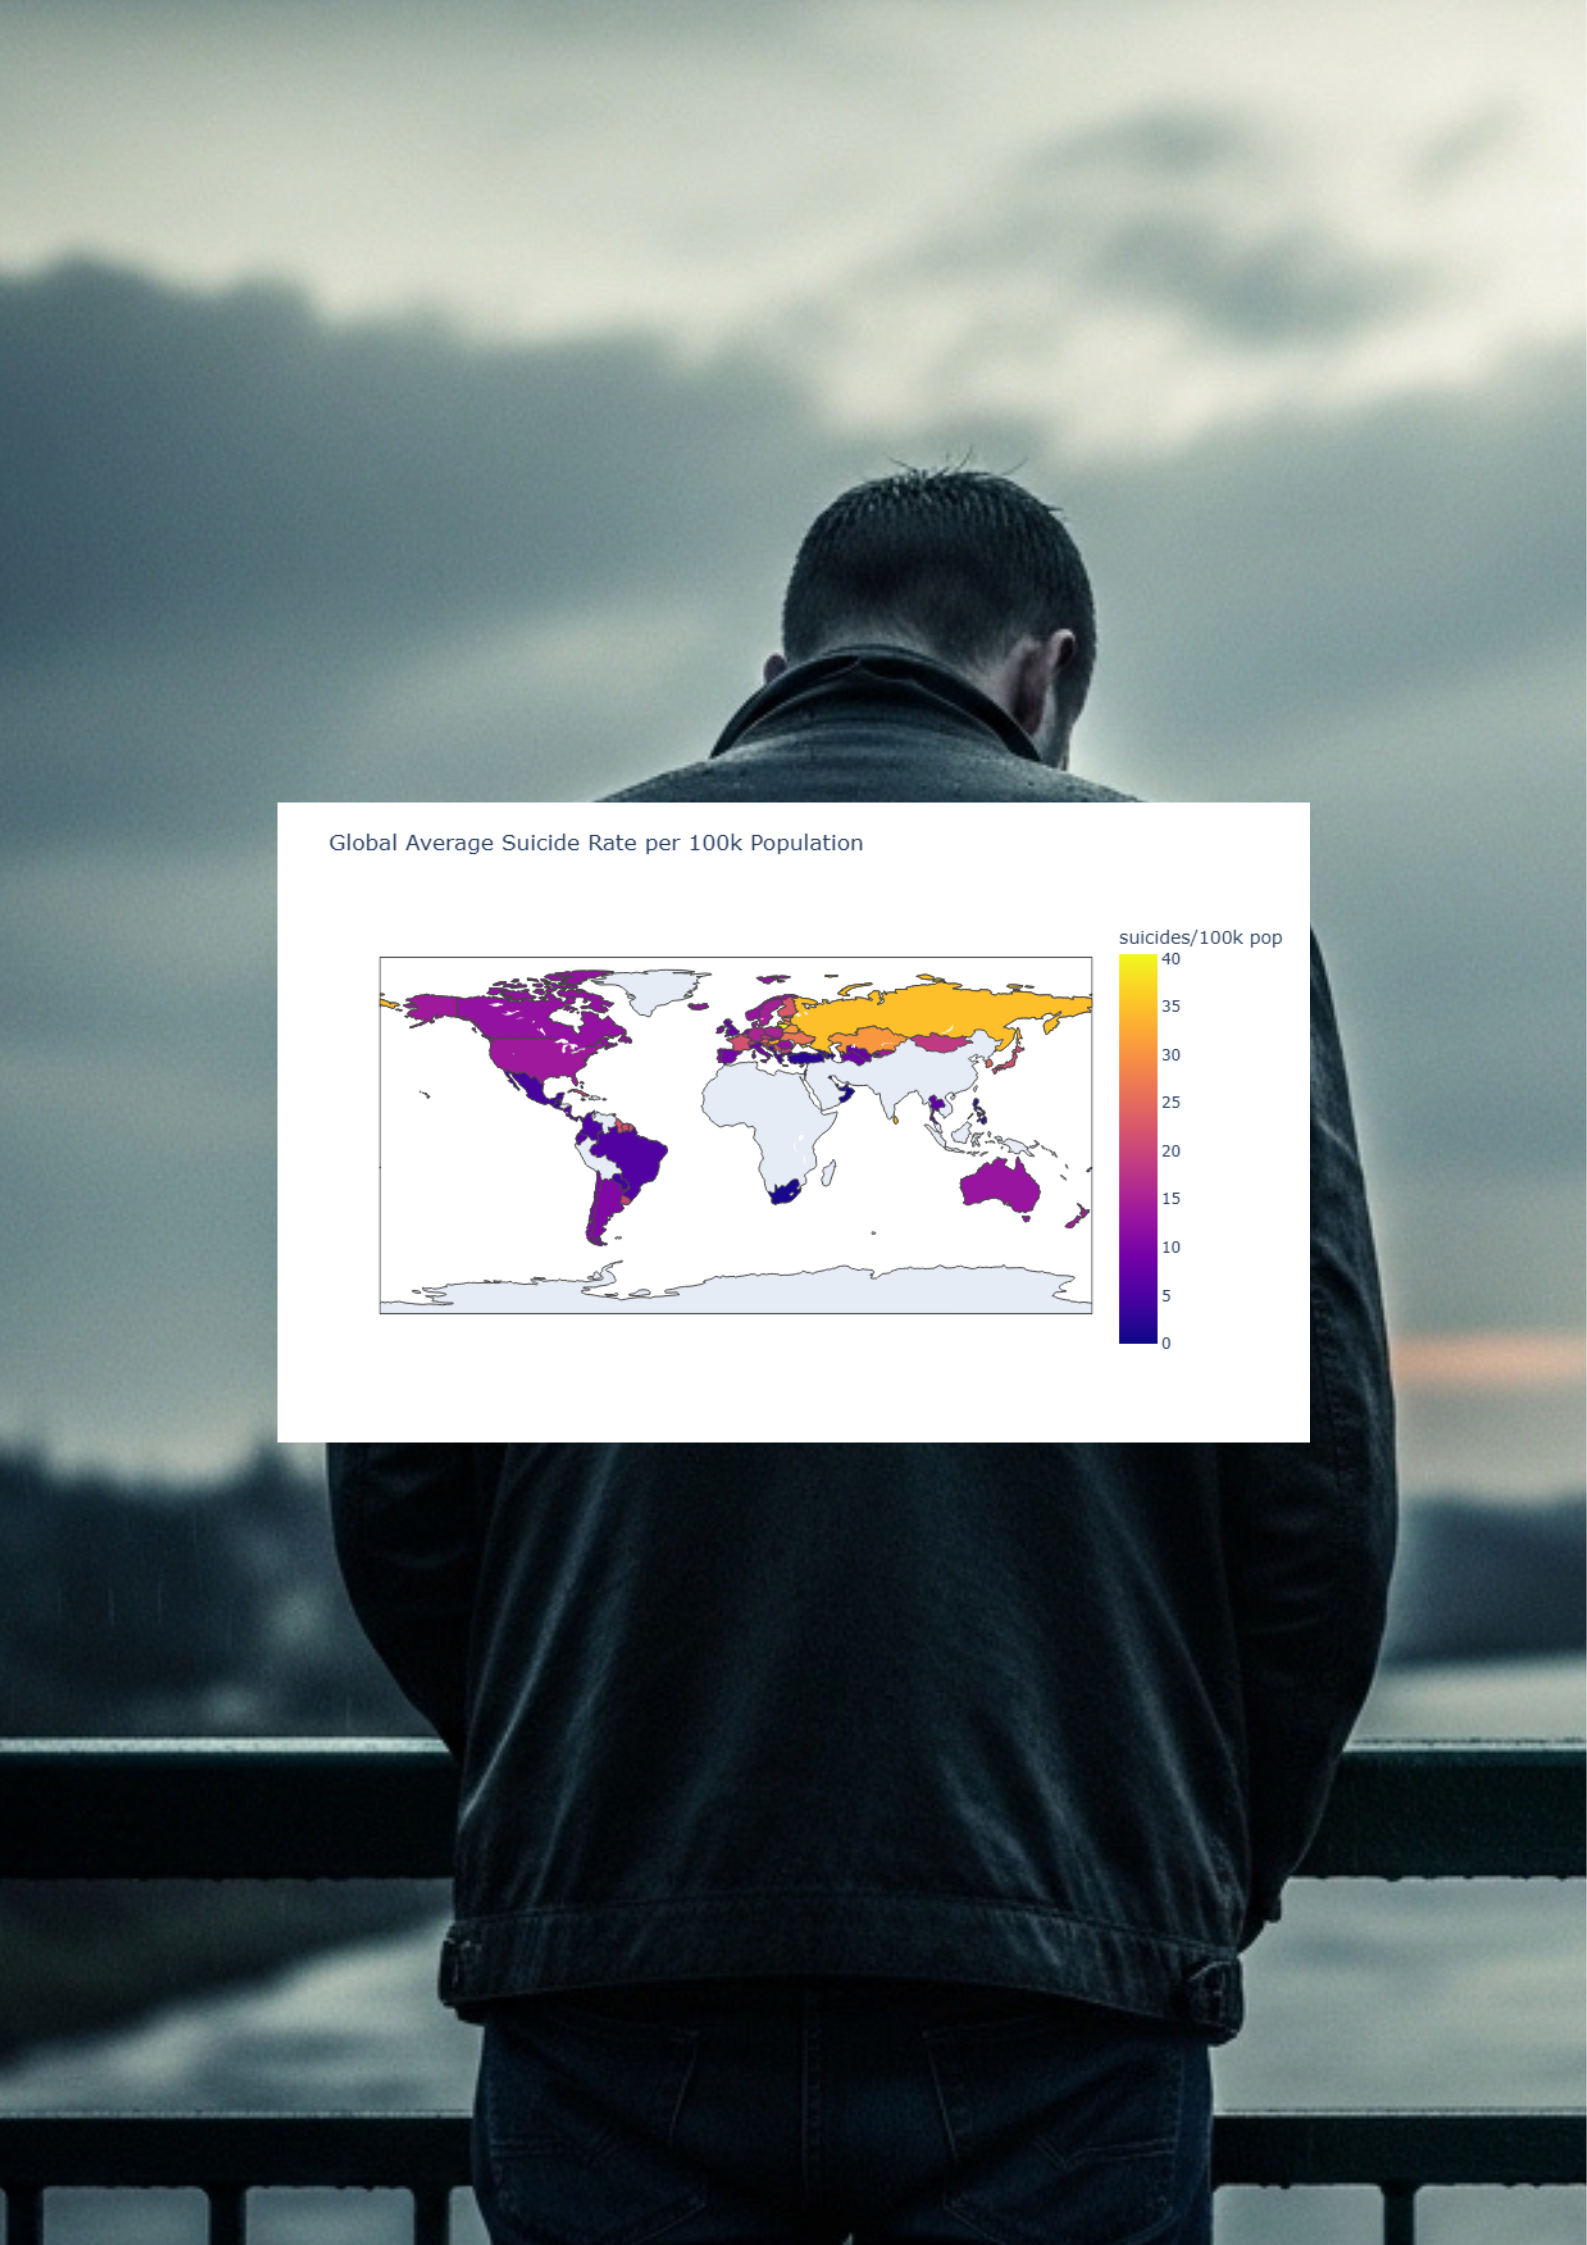
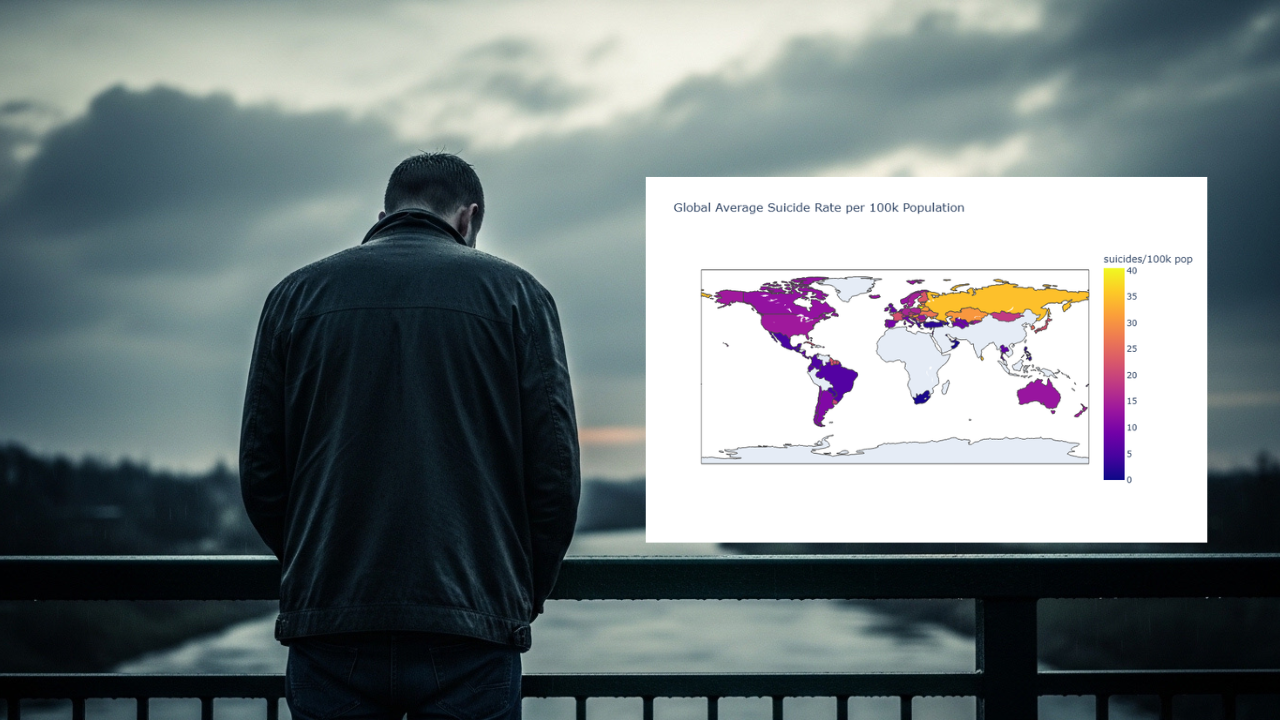
A deep dive into global suicide trends, uncovering demographic concentration, economic myths, and data-backed intervention strategies.
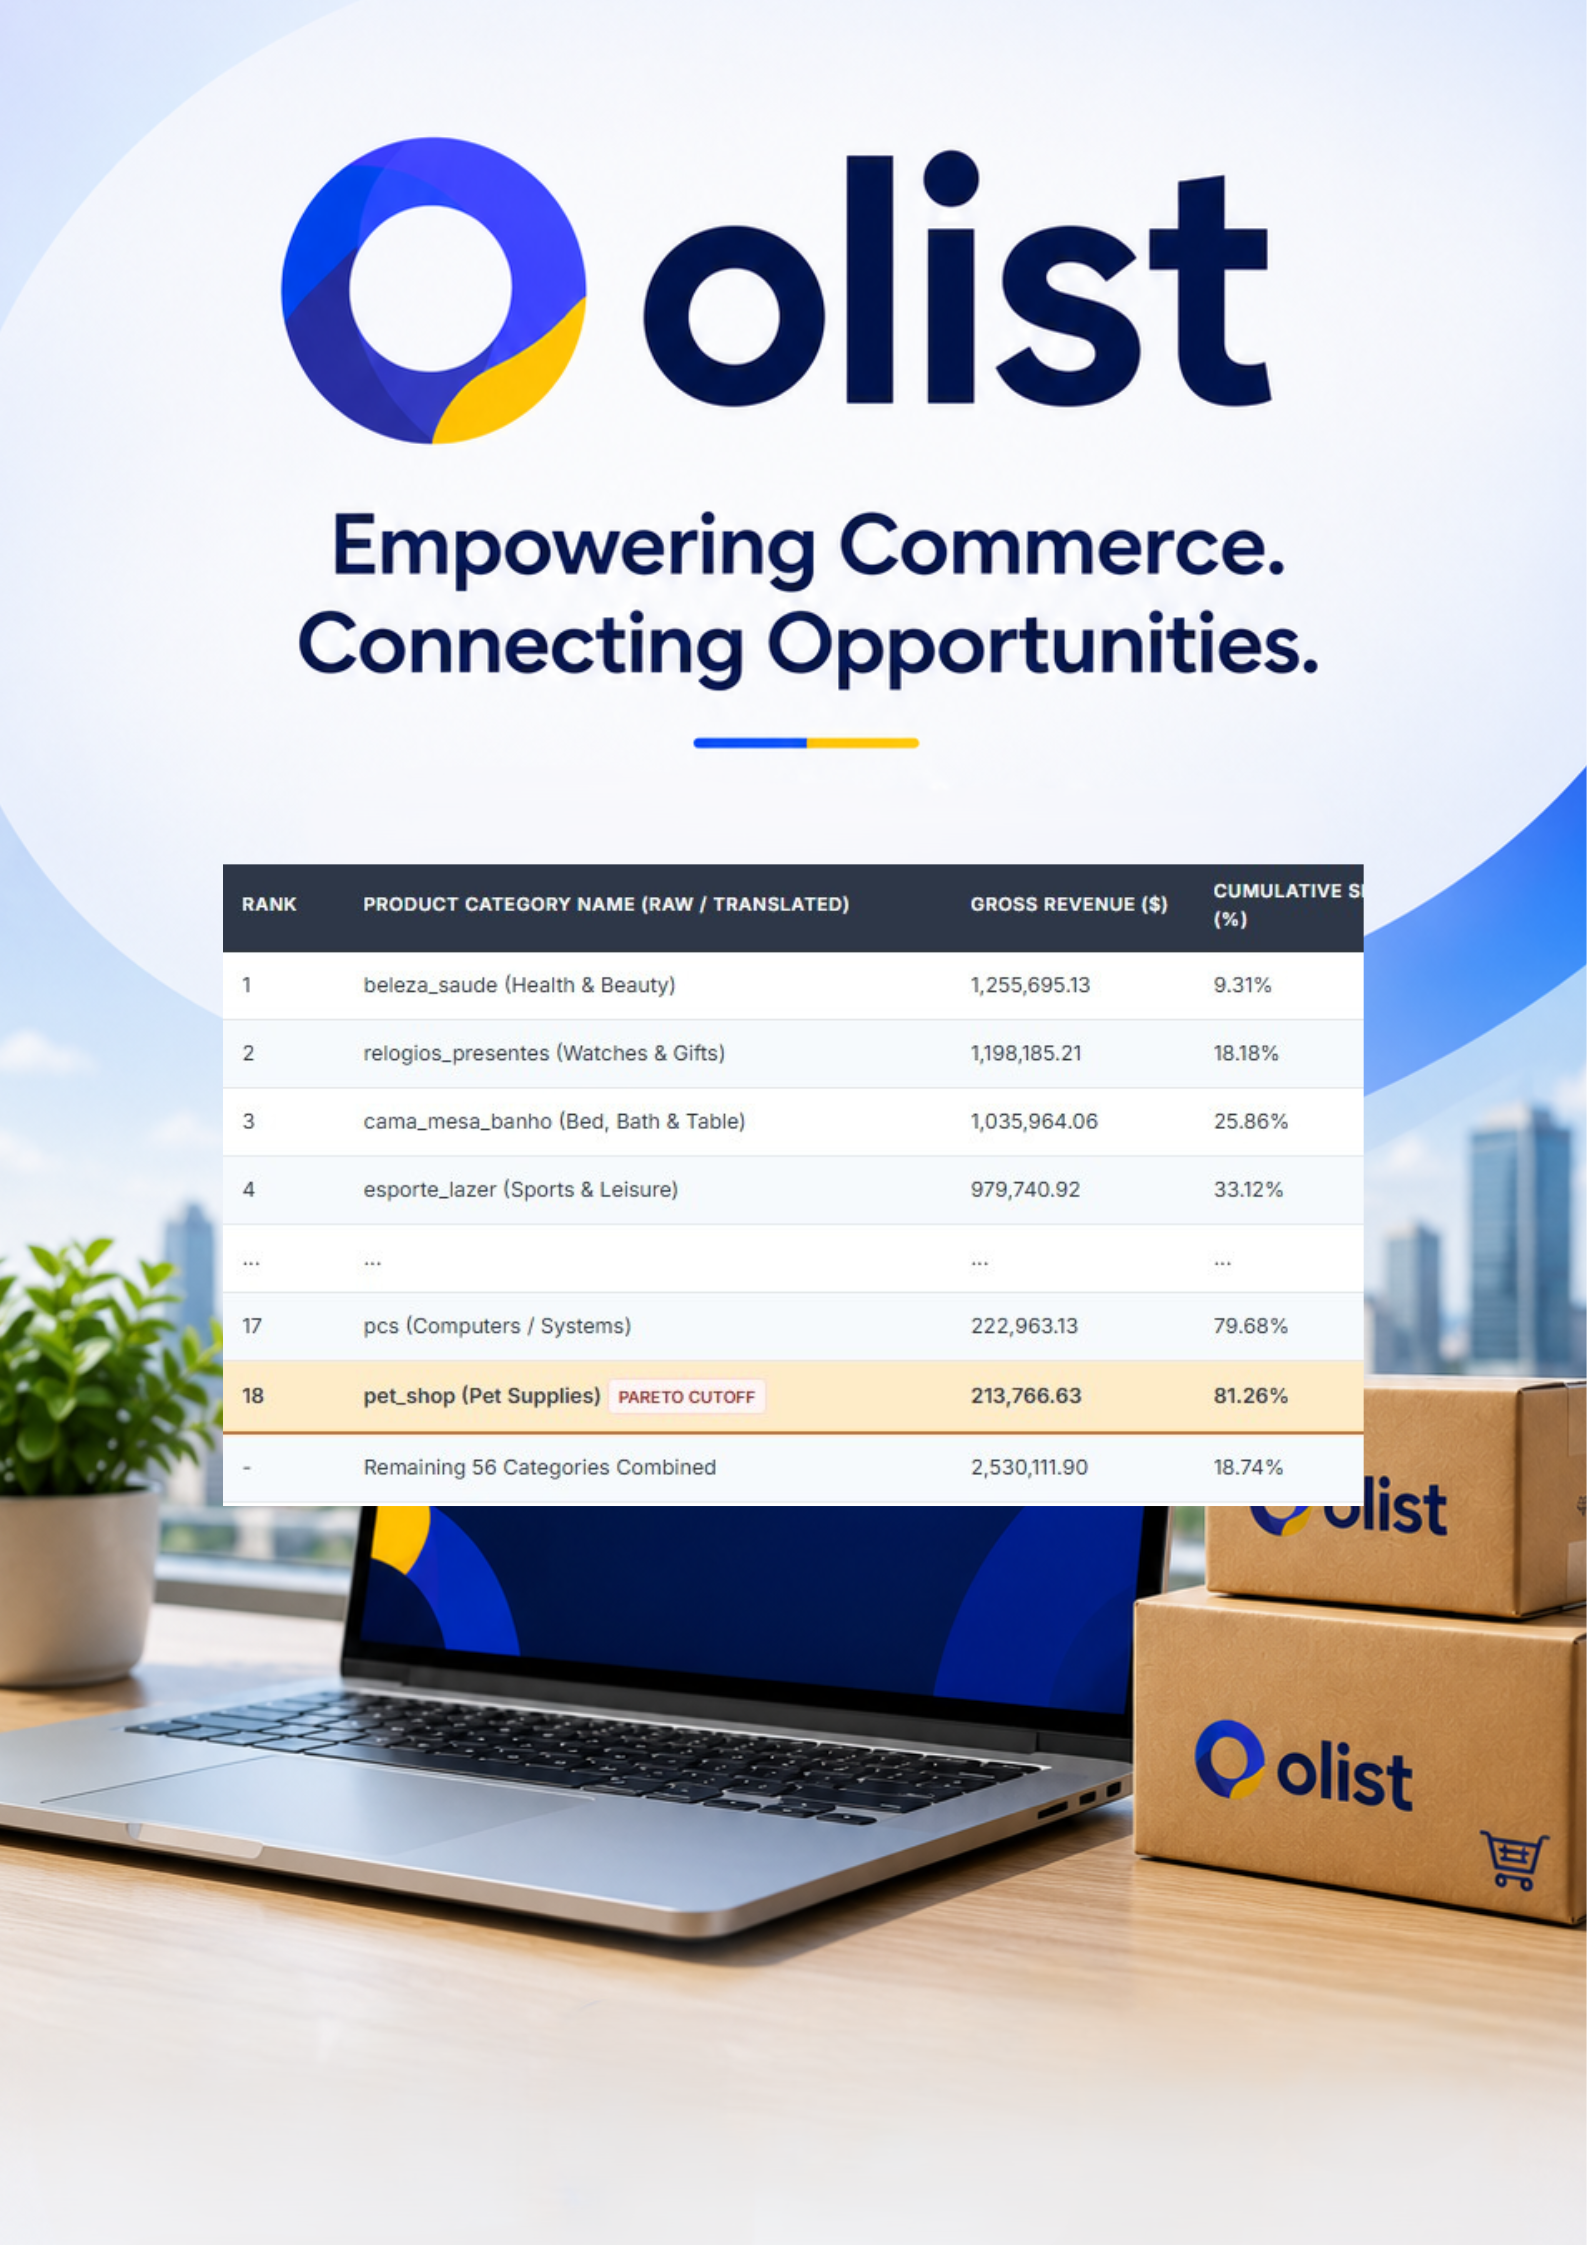
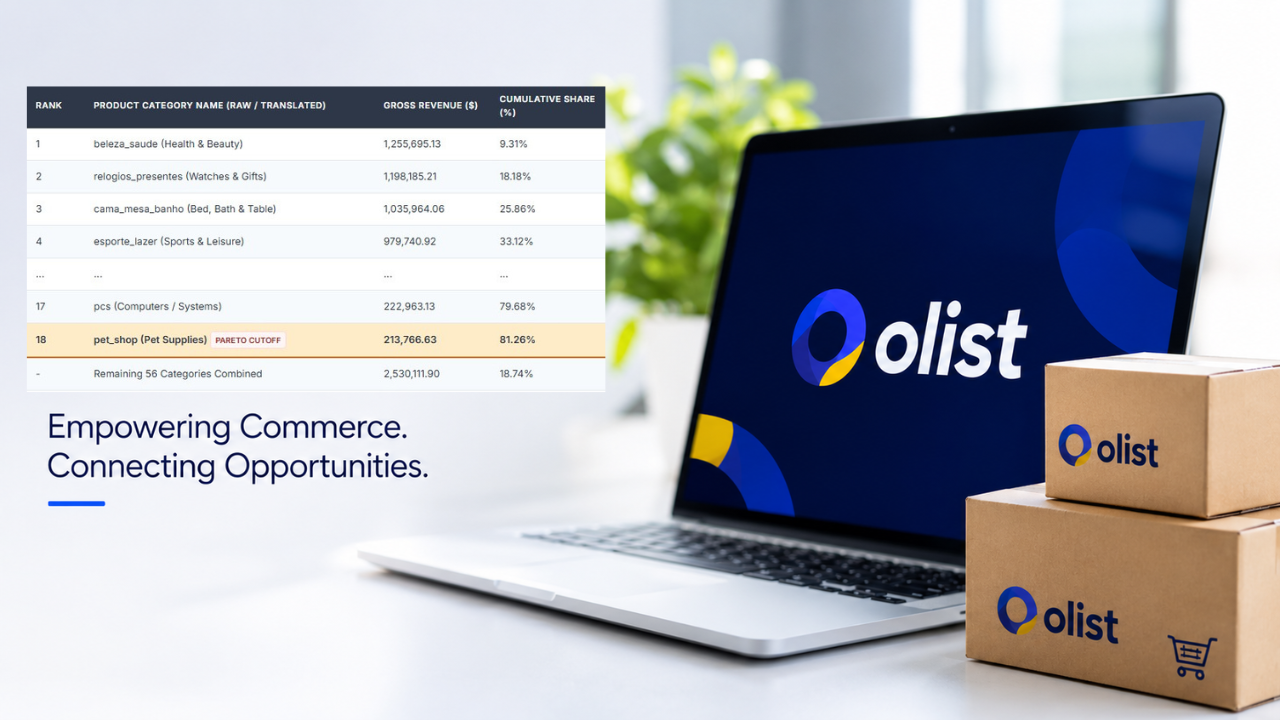
An end-to-end Olist E-commerce analytics project that uncovered revenue concentration, delivery performance gaps, and customer behavior patterns to drive data-backed recommendations for revenue growth, operational efficiency, and customer retention.